Info Design: Exercises
03/02/2025 - 21/02/2025
Ng Zheng Kai 0359424
Bachelor of Design in Creative
Media
Information Design
Exercises
INSTRUCTIONS
Exercise 1
In the first exercise, we are required to quantify (count) our chosen items (buttons/Legos/coins/MNMs) and arrange the objects into a presentable layout or chart. The requirement is that the information must be presented as it is with relevant indicators written out with pens to help us to visualize the quantity and data.
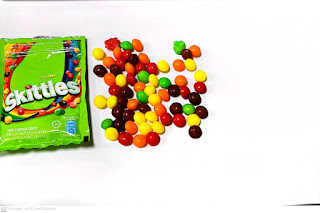
I chose to use Skittles for my task. There are 5 stages for this exercise, which are data, sort, arrange, visualize, and storytelling. For the first stage which is data, is the initial unprocessed raw data, for this I have 65 skittles with different colours.
 |
| Fig 1.1 (1) Data |
For the second stage, I sorted the Skittles based on the colour.
.jpeg) |
| Fig 1.2 (2) Sorted |
 |
| Fig 1.3 (3) Arranged |
For the 4th stage, I made them visually appealing to the viewer by positioning them into a circles similar to the orbital trajectories of the planets of the solar system, the innermost circle consists of the least amount of the colour type of the Skittles, whereas the outermost circle consists of the colour type of the Skittles.
.jpeg) |
| Fig 1.4 (4) Visually |
Finally for the storytelling, I just rearranged the Skittles into an arrow pointing a smiley face.
 |
| Fig 1.5 (5) Story |
Exercise 2
In exercise 2, we have to organize a group of information into a visual poster that combines and utilizes the LATCH principles (Minimum 4). We are required to use the digital photo editing/illustration software available to assemble the information into a LATCH infographic poster. We are allowed to reuse back the images but we do have to create the rest of your visuals to complete the poster.
REQUIREMENTS:
Size resolution: 1240 × 1750 pixels or 2048 × 2048 pixels.
Size resolution: 1240 × 1750 pixels or 2048 × 2048 pixels.
Topic
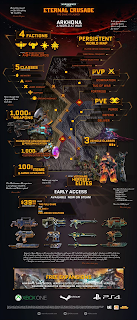
I picked the fictional universe of Warhammer 40K to be my topic, as it contains a complex worldbuilding and plenty of information to go through. I then listed out the information I wanted to include for my L.A.T.C.H poster.
LATCH
- Location: Milky Way Galaxy
Alphabetical:- Time: Timeline of key events
- Categories: Major factions
- Hierarchy: Faction power structure
Visual Reference
To start, I first find some references from Pinterest that are similar to my topic.
Sketch
I started my sketch by positioning the information that I want to put out.
 |
| Final Design |
REFLECTION
This project was both enjoyable and challenging for me. The first exercise required me to work with raw data and translate it into a visual format. Using Skittles as my dataset, I had to count and categorize them based on their colors, which was straightforward but also required precision. Sorting and arranging them into a presentable layout was an interesting process, as I had to think about how to best showcase the information clearly. Writing out the relevant indicators helped me understand how raw data can be transformed into something more meaningful.
The second exercise was more complex as it involved designing a visual poster using the LATCH principles. I had to carefully decide how to categorize and present the information while ensuring the poster remained visually appealing and easy to understand. Choosing which four LATCH principles to use was a thoughtful process, as each approach influenced how the data was perceived. Creating the visual elements and assembling them in a digital format took time, especially in terms of layout, typography, and color choices. Balancing aesthetics with clarity was a bit challenging, but it was a great learning experience in visual hierarchy and information design.
Overall, I found these exercises engaging because they allowed me to explore data visualization in both physical and digital formats. While there are areas for improvement, I am satisfied with how the final outputs turned out, especially in terms of organization and clarity.


Comments
Post a Comment